Convert a continuous variable to the corresponding levels of grey.
Usage
togrey(x, min = 0.1, max = 0.9, alpha = NULL, inverse = FALSE, sqrt = FALSE)

togray(x, min = 0.1, max = 0.9, alpha = NULL, inverse = FALSE, sqrt = FALSE)
Arguments
- x
A numeric vector.
- min
The minimum grey level.
- max
The maximum grey level.
- alpha
The opacity.
- inverse
Logical. By default, bigger is darker. If inverse =
TRUE, bigger is lighter.
- sqrt
Logical. Applies a square root transformation to get more
progressive grey levels.
Value
A vector of colors of the same length as x.
Author
From Clement Calenge, modified by Mathieu Basille
<\email{mathieu@basille.org}>
Examples
bla <- runif(10000)
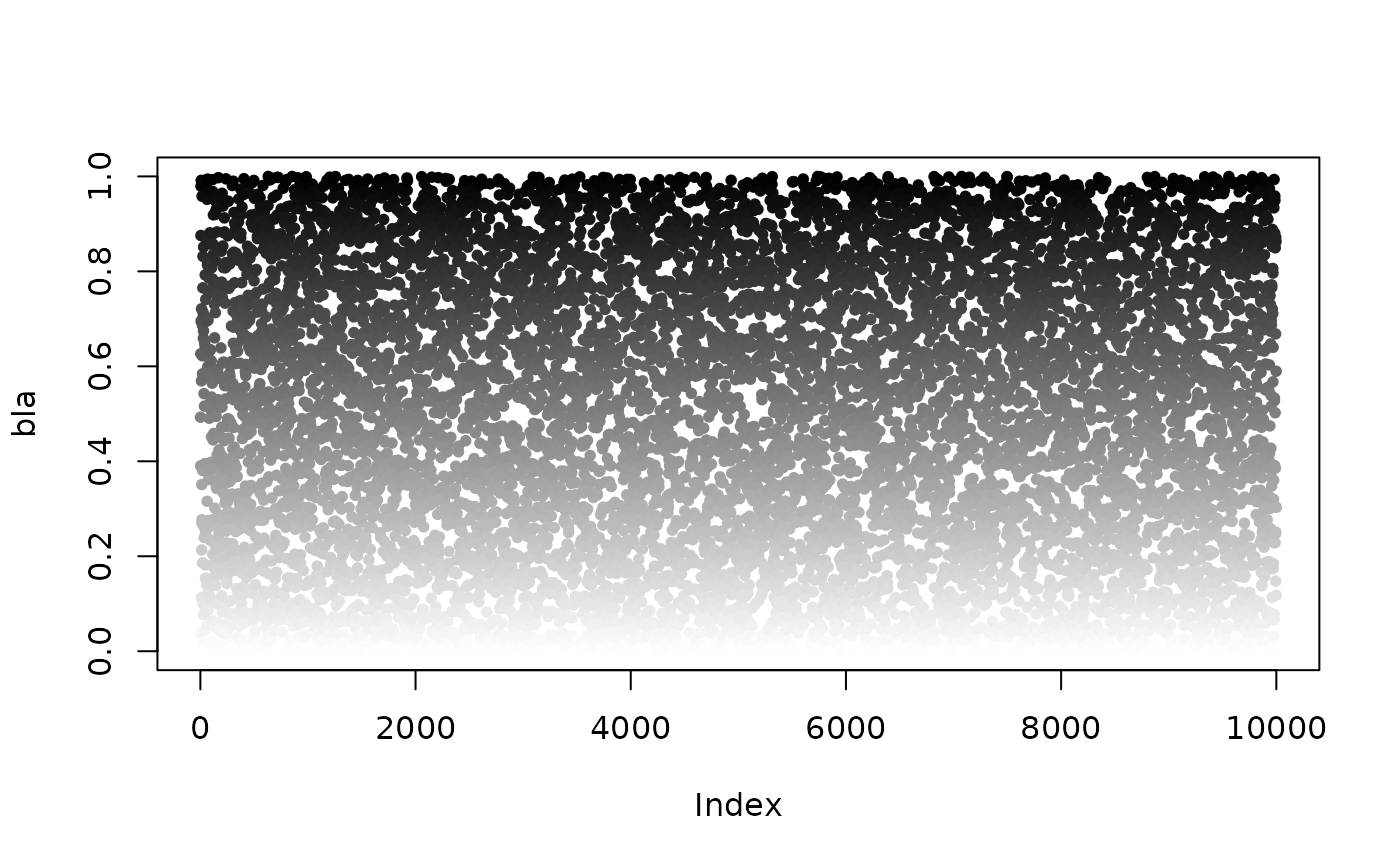
plot(bla, col = togrey(bla, 0, 1), pch = 20)
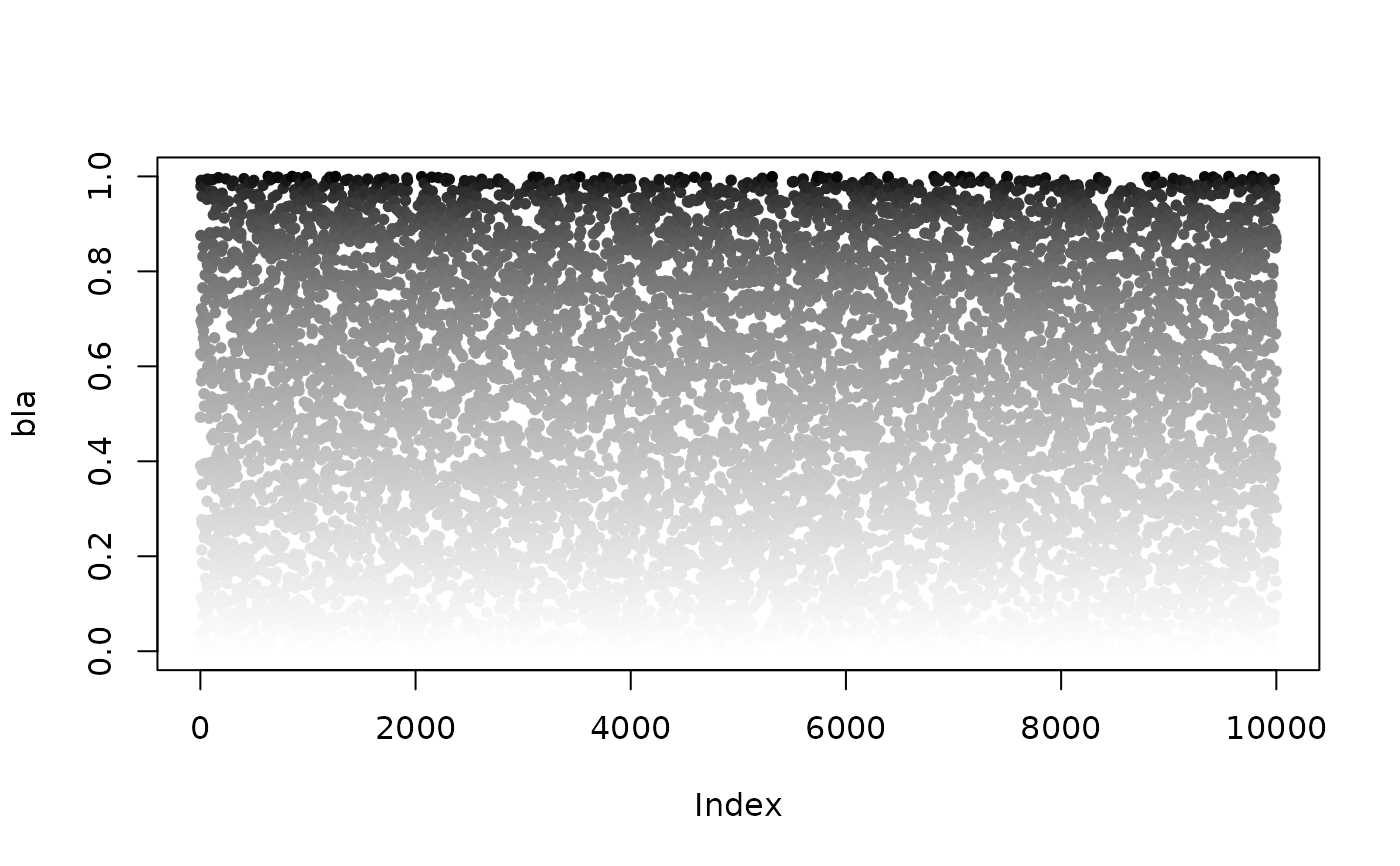
 plot(bla, col = togrey(bla, 0, 1, sqrt = TRUE), pch = 20)
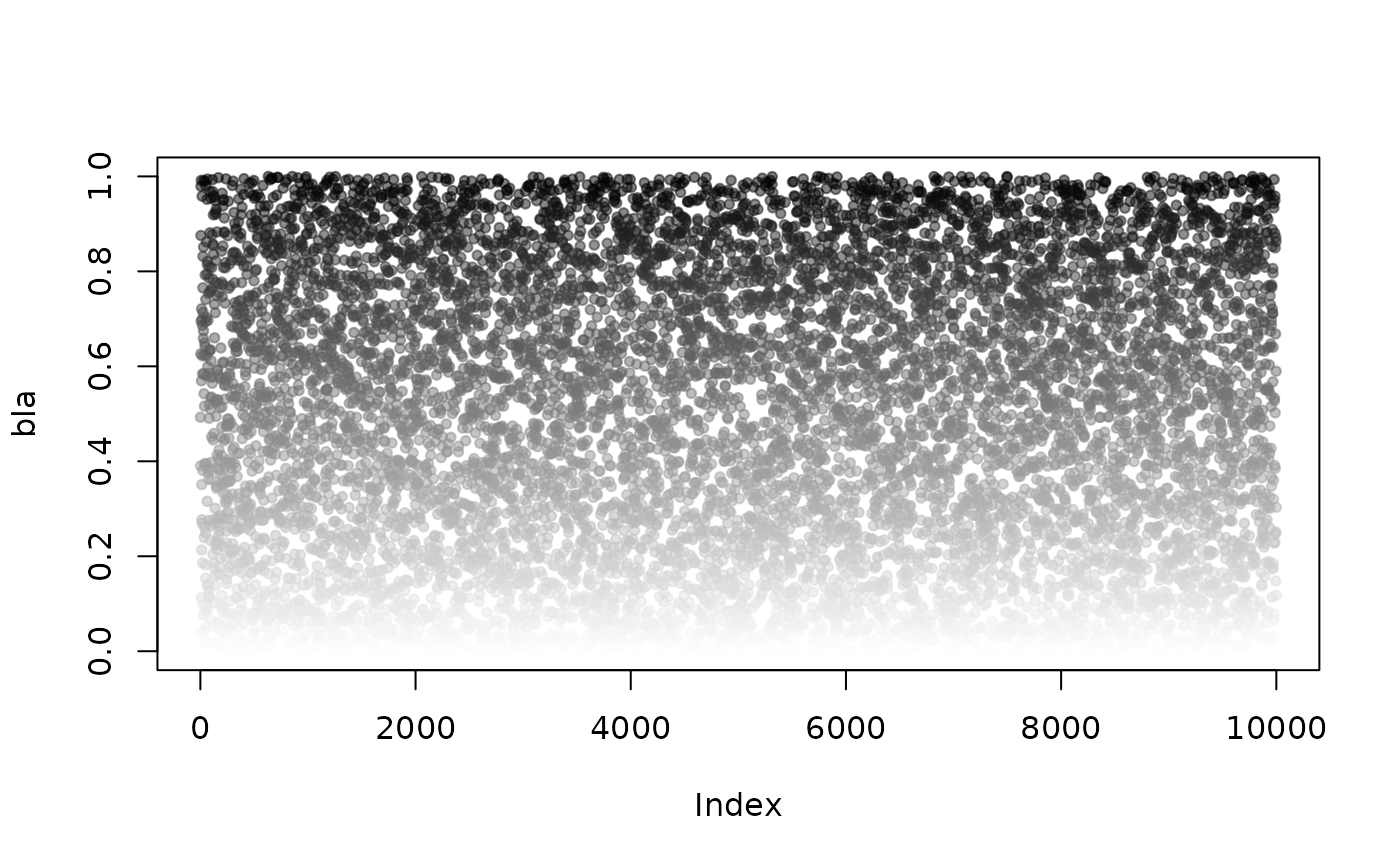
 plot(bla, col = togrey(bla, 0, 1, alpha = 0.5), pch = 20)